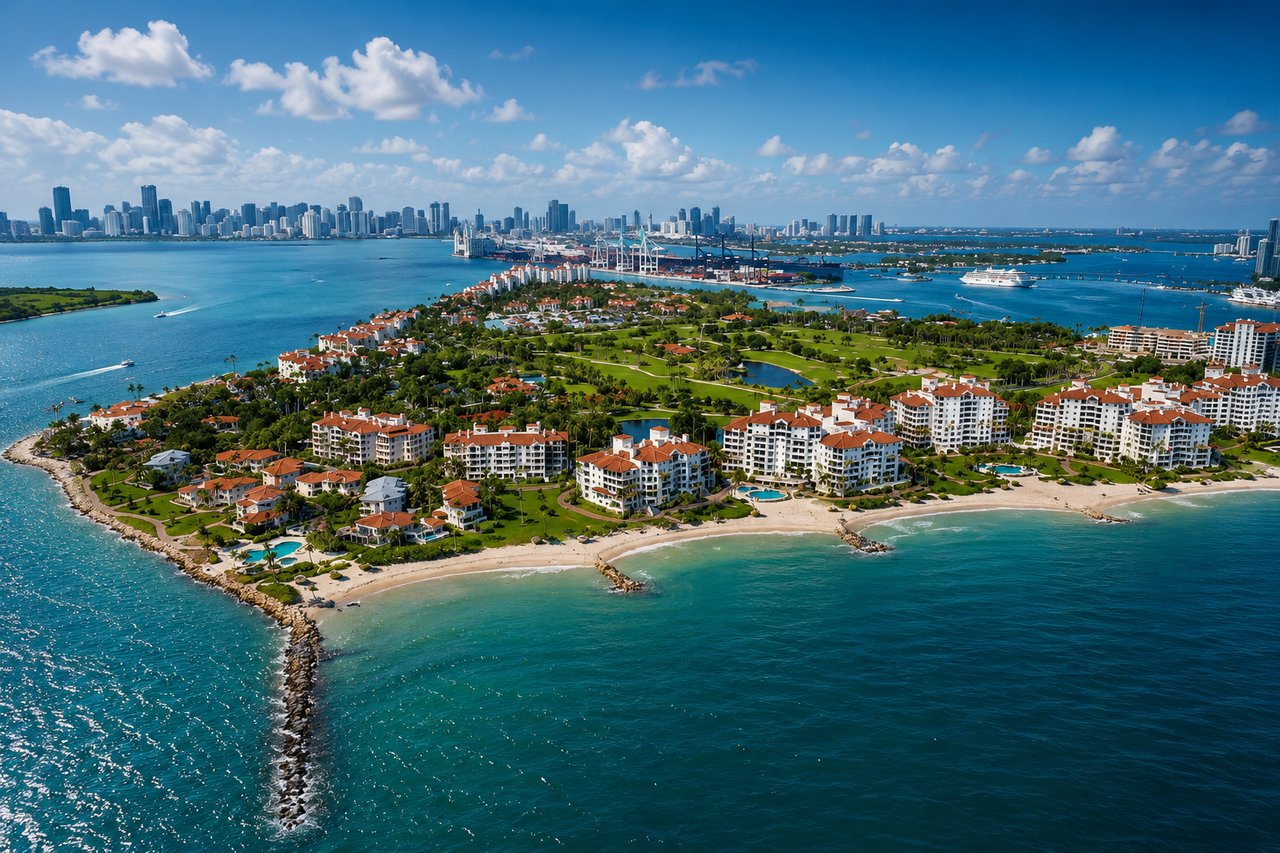
Fisher Island Real Estate Market Update – August 2026
Homes for Sale, Pending Sales, Rentals & 30-Day Market Activity
Last Updated: August 12, 2026
Fisher Island remains one of Miami’s most exclusive and closely watched luxury residential markets. Because of its limited inventory, unique waterfront location and highly specialized housing stock, traditional Miami-wide statistics often fail to tell the full story of what is actually happening on the island. This Fisher Island real estate market update looks directly at current residential inventory, pending transactions, recent sales and rental activity to provide a snapshot of market conditions as of August 12, 2026.
According to current Southeast Florida MLS data reviewed for this report, 41 residential properties are currently offered for sale on Fisher Island, while 5 additional properties are pending. At the same time, 36 residential properties are available for rent.
Fisher Island Market at a Glance
Properties for Sale: 41
Pending Sales: 5
Closed Sales – Last 30 Days: 1
Properties for Rent: 36
Rentals Closed – Last 30 Days: 1
Pending / Active Ratio: 12.2%
30-Day Sales Absorption: 2.4%
Rental Inventory / Sale Inventory: 87.8%
Source: Southeast Florida MLS market snapshot reviewed August 12, 2026. Market conditions, asking prices and listing statuses may change.
41 Properties Are Currently for Sale on Fisher Island
The current Fisher Island inventory consists of approximately 41 active residential listings, with asking prices ranging from approximately $3.75 million to $57 million. That extraordinary price range demonstrates one of the most important characteristics of Fisher Island real estate: this is not a homogeneous market. Inventory includes established waterfront condominiums, newer ultra-luxury developments and a small number of extraordinary single-family residences. At the top of the current Fisher Island market, asking prices include properties offered around:
This wide range is precisely why island-wide averages should be interpreted carefully. A small number of ultra-high-value residences can significantly influence mathematical averages. Buyers should therefore consider individual buildings, price per square foot, floor plan, views, condition, renovation quality and location within the island.
Explore Fisher Island Real Estate & Current Properties for Sale
Only One Fisher Island Sale Closed During the Last 30 Days
One of the most revealing statistics in the current snapshot is transaction velocity. During the 30-day period ending August 12, 2026, one residential sale closed in the Fisher Island market included in this analysis. The property had been offered at approximately $4.15 million and closed at approximately $3.8 million. That represents an approximate sale-to-list ratio of 91.6%, or roughly 8.4% below the final asking price. One transaction is far too small a sample to establish a reliable pricing trend for Fisher Island, but it highlights an important principle: actual closed transactions can provide a very different perspective from asking prices alone.
Fisher Island’s Current Sales Absorption
With 41 properties currently for sale and one closed sale during the previous 30 days, the simple 30-day inventory absorption ratio is approximately 2.4%. Put another way, recent closed-sale volume represents only about 2.4% of today’s active inventory. If that single month were mechanically annualized, current inventory would represent approximately 41 months of supply. However, this should not be interpreted as a conventional market forecast. Fisher Island is a small ultra-luxury market where only a few transactions can dramatically alter monthly statistics. A 60-day or 90-day moving average will eventually provide a much more useful indicator.
Five Fisher Island Properties Are Currently Pending
Closed sales tell us what happened recently. Pending transactions can provide insight into what may happen next. As of August 12, 2026, five Fisher Island properties are currently pending, with asking prices of approximately:
Together, these pending properties represent approximately $179 million in combined asking-price volume. The average asking price among these five pending properties is approximately $35.8 million, while pending inventory currently represents approximately 12.2% of the active for-sale inventory. This is particularly noteworthy because the pending pipeline is concentrated at the very top of the Fisher Island market. If several of these transactions close, they could materially affect the island’s reported average and median sales prices. Pending status does not guarantee that a property will close, and asking prices should never be interpreted as final transaction prices until the sale has been completed.
A Potential Shift at the Top of the Fisher Island Market
The combination of only one recent closing and five pending transactions creates an interesting market dynamic. For every closed sale recorded during the previous 30-day period, there are currently approximately five pending transactions.
Pending-to-Recent-Sales Ratio: 5.0x
This does not mean transaction volume will necessarily increase fivefold. Some pending contracts may be delayed or fail to close. However, it indicates considerably more activity in the pipeline than the recent closed-sales number alone might suggest.
Fisher Island Rental Market
The rental side of the Fisher Island market is also significant. There are currently approximately 36 active residential rentals. Monthly asking rents visible in the current inventory begin around $15,000 per month for traditional monthly rentals and extend above $30,000 per month, depending on residence size, building, location, furnishings and seasonality. The active rental inventory includes residences in communities such as Seaside Village, Bayside Village and Oceanside.
With 36 rentals compared with 41 properties for sale, current rental inventory equals approximately 87.8% of the size of the for-sale inventory. This highlights the importance of the rental market within Fisher Island’s broader residential ecosystem.
One Fisher Island Rental Closed During the Last 30 Days
During the same 30-day period, MLS data reviewed for this report shows one completed residential rental transaction. The furnished three-bedroom residence, located in Seaside Village, rented for approximately $35,000 per month and offered approximately 2,049 square feet of living space. Based on 36 currently available rentals, the simple 30-day rental absorption ratio is approximately 2.8%. As with sales, one month of rental activity should not be viewed as a reliable long-term trend, particularly in a market that can be highly seasonal.
Sales vs. Rentals: An Interesting Fisher Island Indicator
One statistic immediately stands out:
41 properties for sale versus 36 properties for rent.
For every 100 residences currently offered for sale, there are approximately 88 rental properties available. This ratio will be particularly interesting to monitor over the coming months. If rental inventory begins declining while sales inventory remains relatively stable, it may suggest strengthening rental demand. Conversely, increasing inventory in both categories without corresponding transaction growth could create greater negotiating leverage for buyers and tenants.
Fisher Island Market Indicators
Sales Absorption: 2.4%
Pending-to-Active Ratio: 12.2%
Pending-to-Recent-Sales: 5.0x
Rental-to-Sale Inventory: 87.8%
Pending Asking Volume: Approximately $179 million